Vision Zero Update: Guiding Principles & Focus Areas
On 15 December 2022, I attended the second Vision Zero Technical Advisory Committee (TAC) meeting. The meeting focused on updates, Guiding Principles, Data, and Focus Areas.
Updates - Vision Zero Logo, Website, & Social Media Accounts:
Be on the lookout for the official launch of the Vision Zero website and social media accounts sometime this month (January 2023). The website will include a crowd-sourced public engagement map, sign-up link for ongoing information and, short survey. Please bookmark this site once it’s up and running!
Omaha’s Vision Zero logo
The logo to the left is now the permanent brand for Omaha’s Vision Zero efforts - we hope to see this image put to good use around the whole city!
Guiding Principles:
Every plan needs deliberate principles to guide the decision-making, and Vision Zero is no different. WSP, the Vision Zero consultant for the City of Omaha, put together a list of Guiding Principles based on feedback from the Vision Zero Executive Committee and Vision Zero Technical Advisory Committee, and the recommendation report by the original Vision Zero Task Force.
The Guiding Principles will be used throughout the entire Vision Zero process to ensure we stay true to established values and to be used for accountability once the Vision Zero Action Plan is implemented.

Focus Areas/Focus Groups:
The majority of the second TAC meeting was devoted to a presentation on traffic data. WSP compiled years of traffic data for the City of Omaha into coherent, comprehensive summary statistic graphs. The data analysis used Omaha, NDOT, US Census Bureau, and Replica data to understand crash mapping, crash statistics, and systemic risk analysis. This data helped determine the Focus Areas for the Vision Zero Action Plan.
Each of the Focus Areas will have a Focus Group that will be composed of 5 to 10 members of the TAC. Focus Group meetings begin at the end of January, which is definitely when the work will begin. These Focus Groups will help the whole committee IDENTIFY the issues so we can SOLVE the problems.
The Focus Groups, as they currently stand, are:
Equity
Speed
High Risk Arterial Roads
two-way and one-way with a special focus on one-way
truck routes
undivided (no median)
moderate traffic congestion
Intersections
traffic signals
angle crashes
rear end crashes
Pedestrians and Bicyclists
High Risk Users
motorcyclists
young users
male users
Occupant Protection
seat belts
motorcycle helmets
Impairment
Funding Policies and Processes
SOS is most interested in working on the Intersection and Speed Focus Groups.
Data Analysis:
See below for data on Omaha’s streets presented at the meeting. Notice the slides correspond to the Focus Areas above. The data in these slides does not include above-grade interstates (i.e. Interstate 80, etc.), but does include local highways like Dodge Street (HWY 6) and Maple Street (HWY 64), etc.
Remember, these slides represent what are called KSI crashes. KSI means “killed” and “serious injuries,” which are the types of crashes that Vision Zero focuses on, not fender benders or minor-injury crashes. However, ANY crash can cause emotional torment or mental anxiety and should not be trivialized, but Vision Zero works specifically to prevent fatal and serious injury crashes.
Unless otherwise stated, the slides represent data from 2015-2019 or 2016-2020.

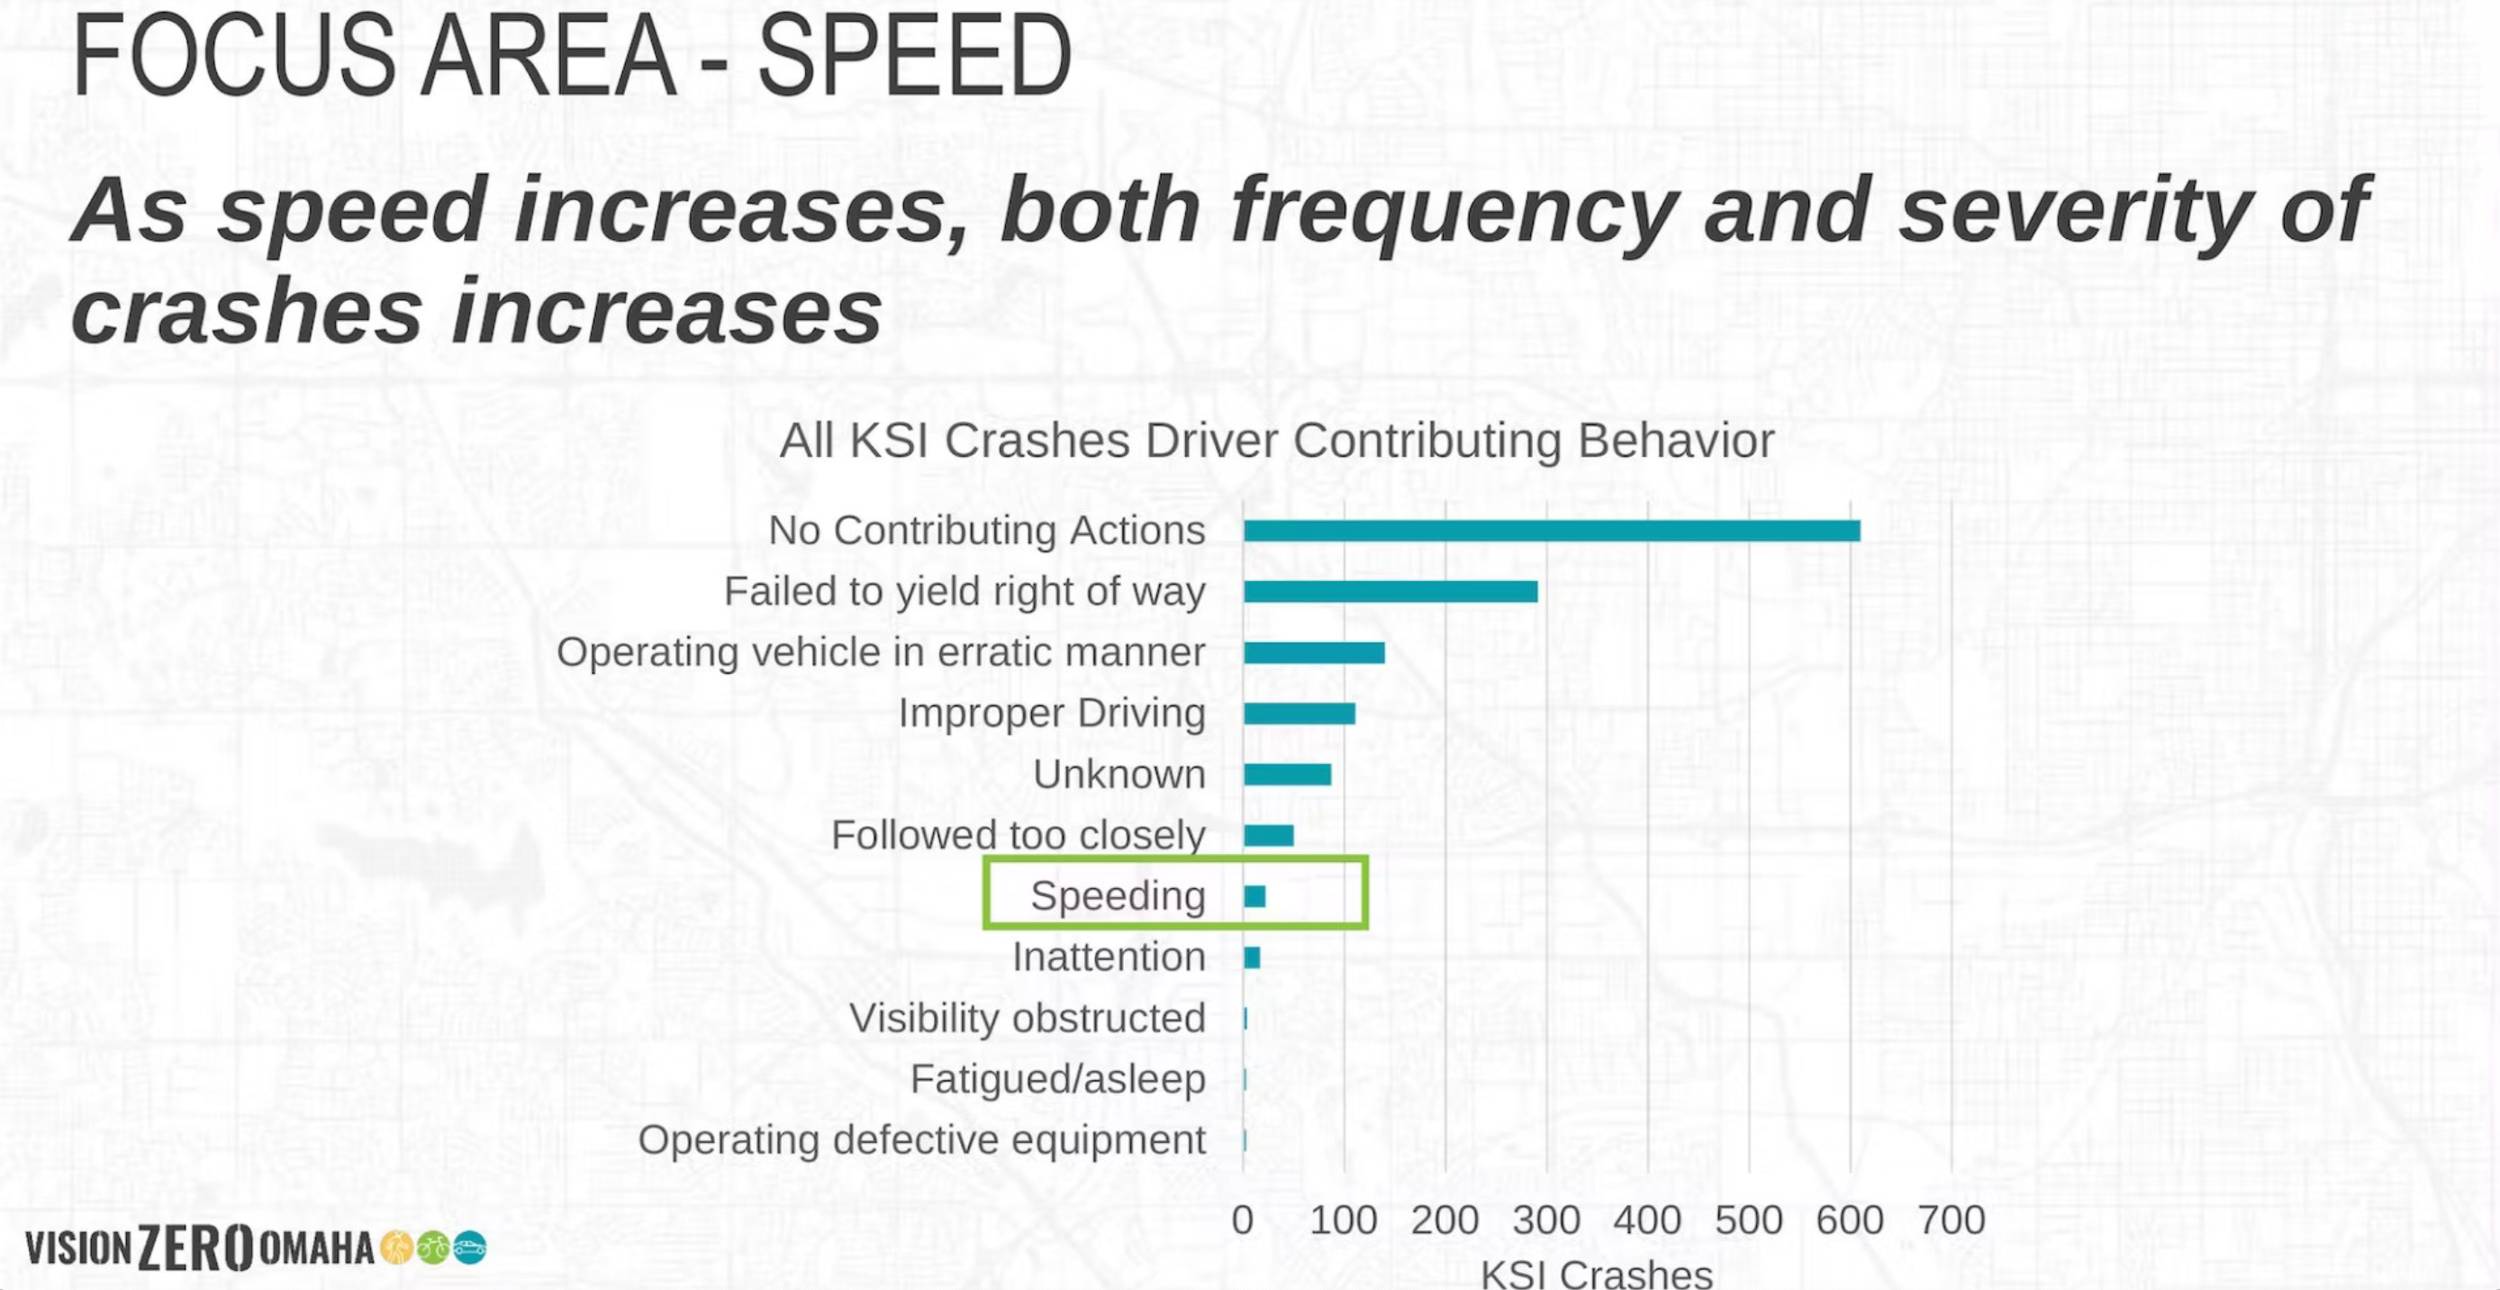
Speeding wasn’t shown to be nearly the problem I thought it was. However, more than speeding, we believe Omaha has a speed variance problem - where drivers are all driving drastically different speeds instead of a rate of speed within 5 to 10 miles of each other.

This slide highlights where speed IS a problem. . .
65% of fatal or serious injury crashes happened at 35 mph or higher

This slide above shows a correlation between one-way streets and bike or pedestrian crashes. I’m wondering if this number is also higher not just because of the nature of the roadway but because most of the one-way streets in Omaha are in midtown and downtown, areas with traditionally higher numbers of cyclists and pedestrians. Either way, interesting!

This slide shows how the presence of medians can increase safety.
Would road diets that included medians as well as multimodal lanes help solve this problem?! I don’t know, but I will ask this question as we develop the Action Plan.
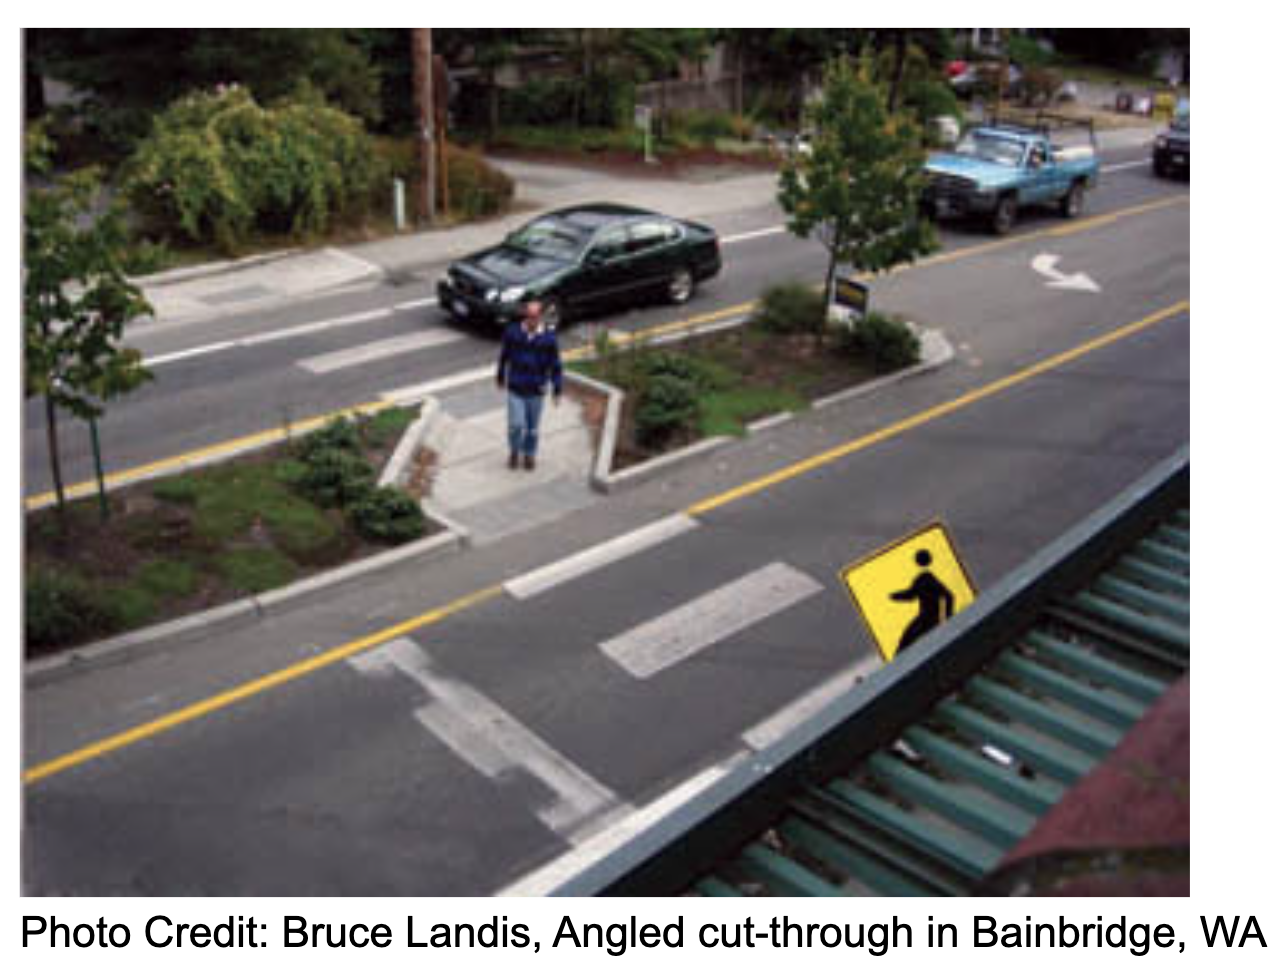
The photo to the right from the Federal Highway Safety Administration shows a median that also functions as a “pedestrian refuge” area. Very cool. And that photo is a decade old, so let’s get our city up to (safe) speed!


Cyclists and pedestrians endure a disproportionate amount of crashes, as you can see above. Pedestrians account for 2% of road users, but 13% of fatal and serious injury crashes. Cyclists account for less than half of one percent of road users but endure 3% of fatal and serious injury crashes.
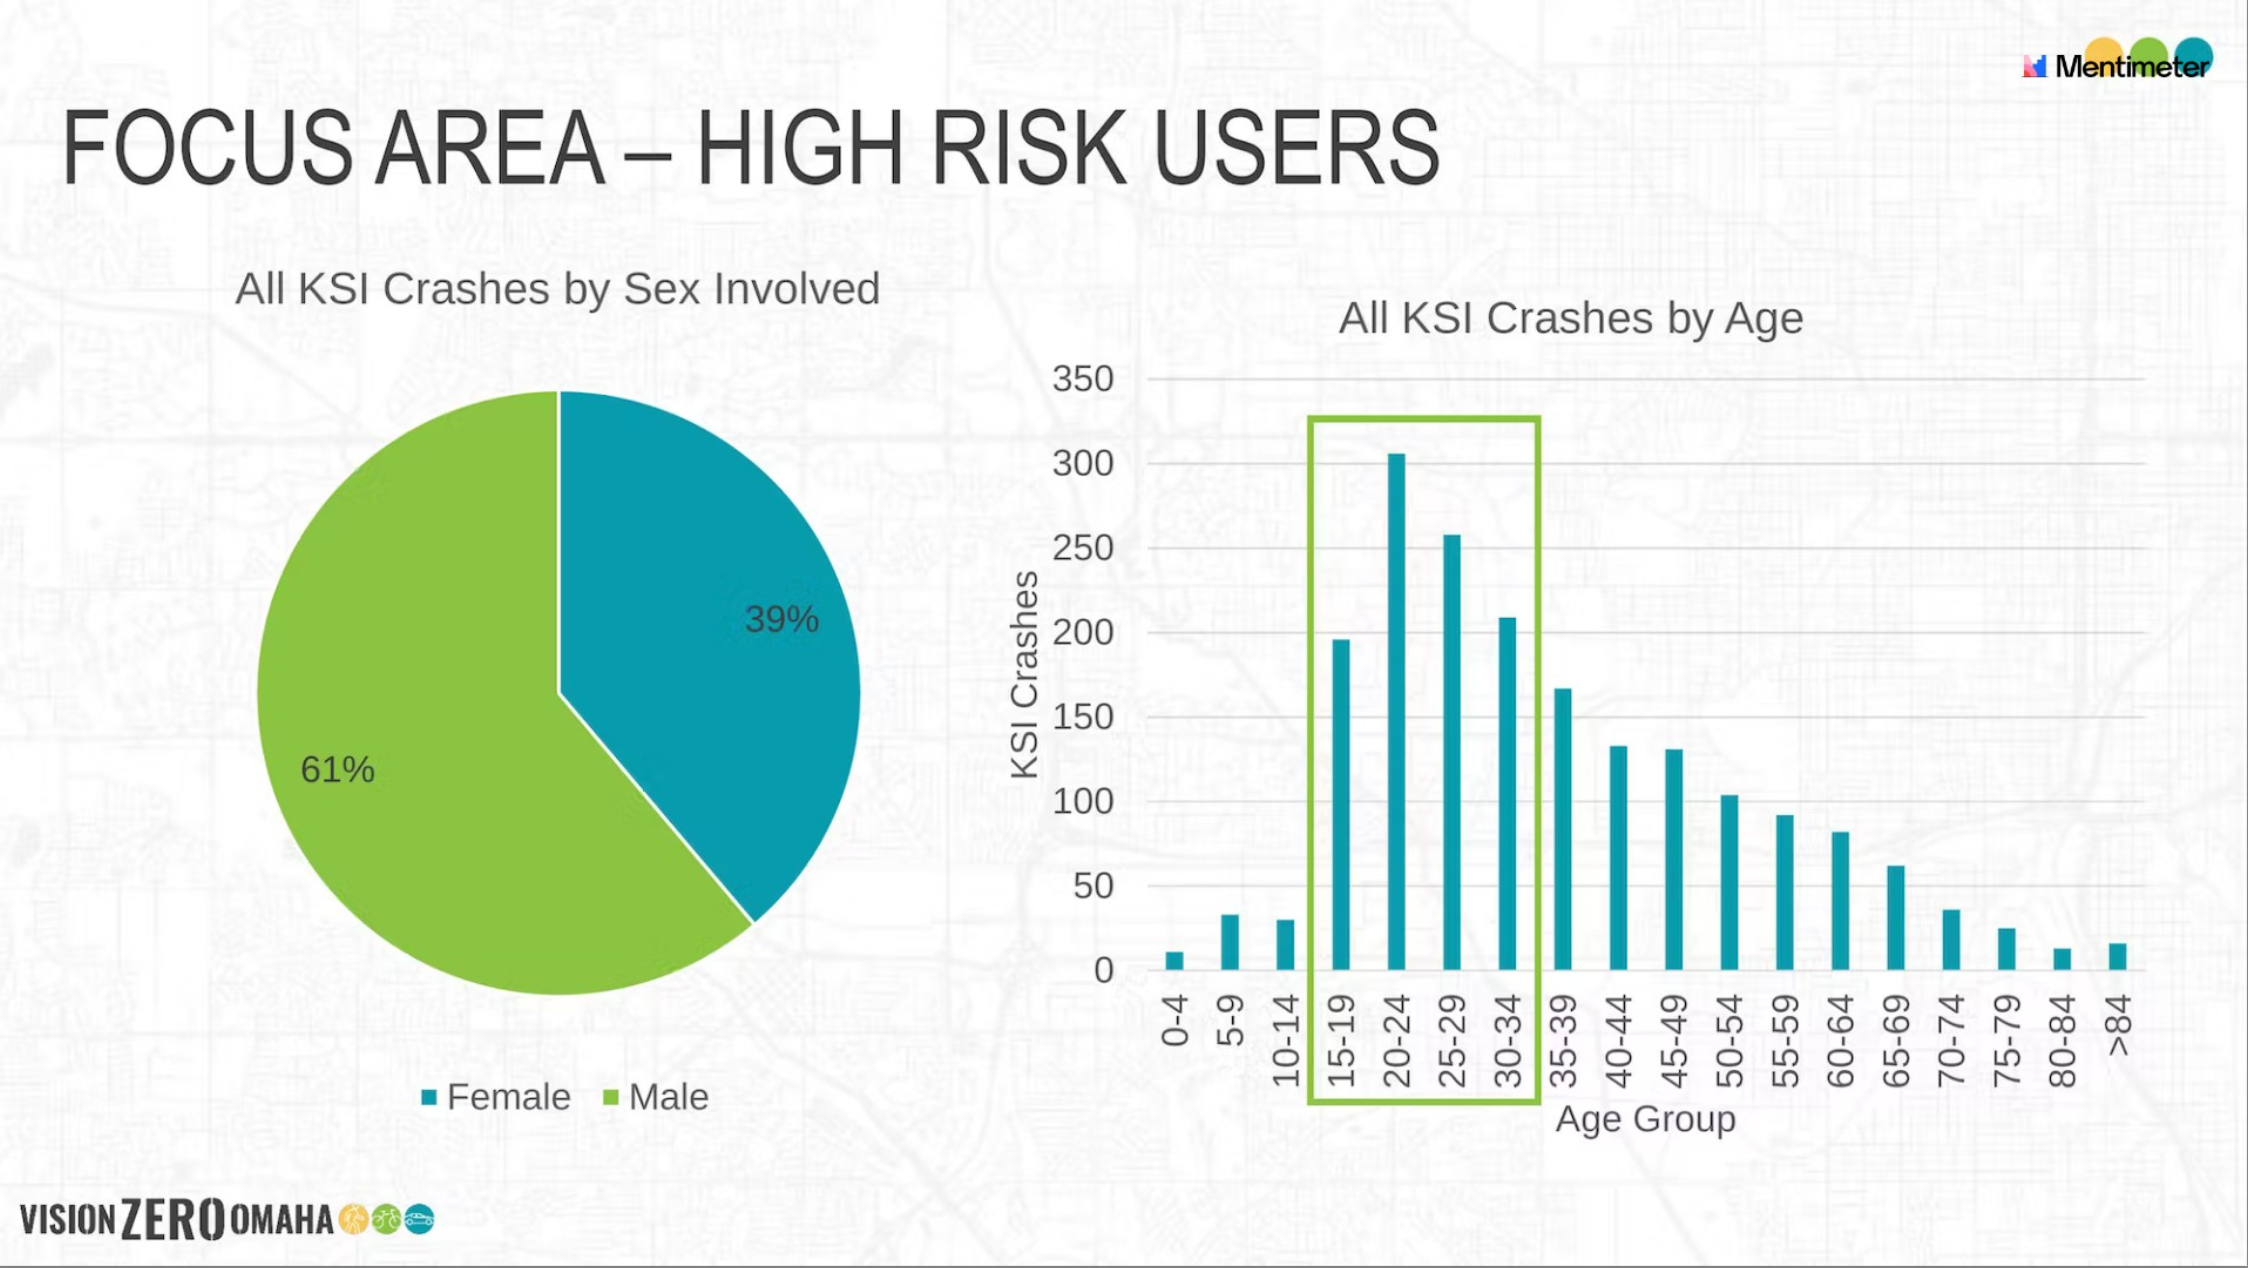
The data doesn’t bear out the stereotype that women are the bad drivers.
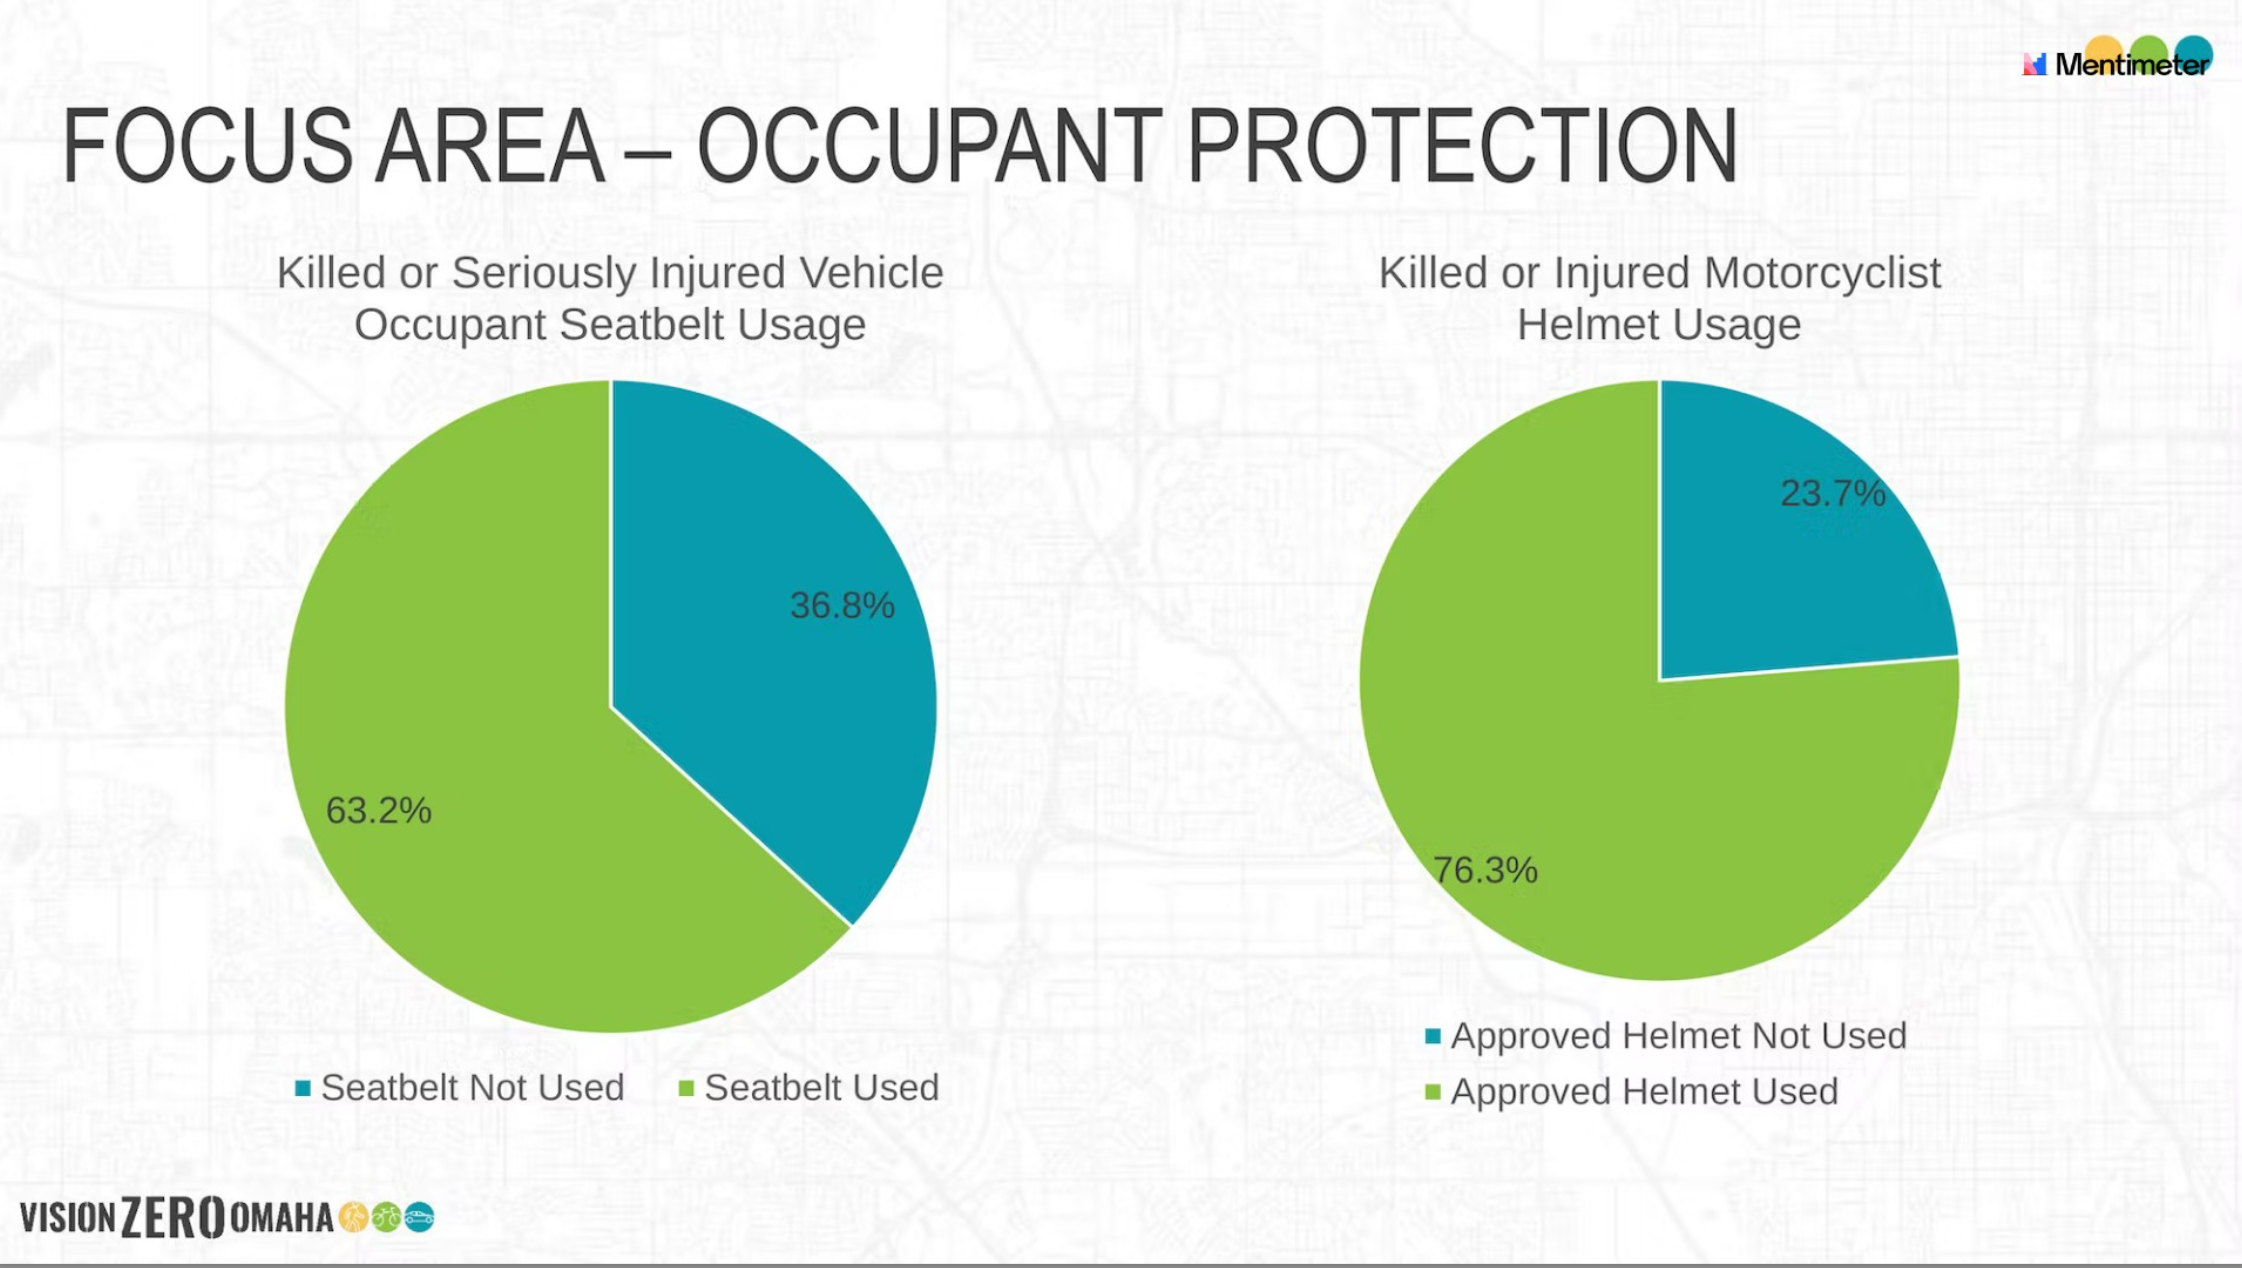
Nebraska is notorious for low seat-belt usage, but even Omaha - when compared with comparable cities - has a poor seat belt usage too. And helmet use, especially what are referred to as DOT (Department of Transportation) approved helmets, is comparably low here as well.

In both vehicular crashes (above) and pedestrian crashes (below), alcohol was LESS of a factor in serious injury crashes, but WAY MORE of a factor in fatal crashes. We have an alcohol problem, not just in this city and state but in the country.


Many of us were surprised that distracted driving wasn’t more of an issue, but apparently it’s hard to identify as a contributor to a crash.
And don’t forget, we are one of just a few states where police CANNOT pull someone over JUST for distracted driving, i.e. texting, etc., which means maybe it is harder to gather data on distracted driving.
A few of my main takeaways from the data presented at the meeting:
More arterial crashes in Omaha than in the nation
Way fewer people use restraints than in similar cities
Low rates of DOT-approved helmet usage
Data indicates that one-way roads are dangerous
More fatal and serious injury crashes occurred on roads with moderate congestion, vs high congestion or un-congested
2/3 of fatal and serious injury crashes are at signalized intersections
The vast majority of fatal and serious injury crashes are between 4 pm and 6 pm on weekdays, with a small spike on Friday evenings and Saturday/Sunday late night to early morning